


The ViennaRNA Package
The ViennaRNA Package consists of a C code library and several stand-alone programs for the prediction and comparison of RNA secondary structures.
RNA secondary structure prediction through energy minimization is the most used function in the package. We provide three kinds of dynamic programming algorithms for structure prediction: the minimum free energy algorithm of (Zuker & Stiegler 1981) which yields a single optimal structure, the partition function algorithm of (McCaskill 1990) which calculates base pair probabilities in the thermodynamic ensemble, and the suboptimal folding algorithm of (Wuchty et.al 1999) which generates all suboptimal structures within a given energy range of the optimal energy. For secondary structure comparison, the package contains several measures of distance (dissimilarities) using either string alignment or tree-editing (Shapiro & Zhang 1990). Finally, we provide an algorithm to design sequences with a predefined structure (inverse folding).
In case you are using our software for your publications you may want to cite:
ViennaRNA Package 2.0
Algorithms for Molecular Biology, 6:1 26, 2011, doi:10.1186/1748-7188-6-26
News
-
06 - 09 - 2023
With version 2.6 we introduce modifed base support and mono-valent salt corrections! Several of our executable tools received support for adding additional energy parameters for modified bases, such as inosine, pseudouridine or m6A, just to mention a few. The implementations allow for easily adding more parameters if they become available. Additionally, we finally integrate a physics-based model to correct energy contributions based on the concentrations of mono-valent ions in solution, such as sodium. This correction is available for virtually all executable programs and easily accessible within our C-library. For a full list of changes, bug fixes and additional features, have a look at the Changelog for version 2.6.0.
-
11 - 08 - 2021
The all new release of version 2.5 brings multi-strand interaction prediction! The new executable tool
RNAmultifoldis the successor of the RNA-RNA dimer interaction prediction toolRNAcofoldand effectively lifts the restriction to just two interacting strands. It follows the same principle of concatenating the RNA strands that shall form a complex and then predicts MFE and partition function. Along with that, it can also compute equilibrium concentrations of the complexes formed. See the Changelog for version 2.5.0 for a complete list of additions, novel features and fixed bugs. -
08 - 01 - 2017
With version 2.4 sliding-window structure prediction receives the constraint framework! Starting with this version, the sliding-window secondary structure prediction implementations as available through
RNALfold,RNAplfold, andRNALalifoldare constraints-aware. Thus, they can readily incorporate RNA structure probing data, such as from SHAPE experiments, etc.
See the Changelog for version 2.4.0 for a complete list of new features and bugfixes. -
11 - 01 - 2016
Version 2.3 introduces the unstructured domain extension of the RNA folding grammar! This extension adds RNA-ligand interactions, e.g. RNA-protein, for unpaired stretches in RNA secondary structures. The feature is easy to use through the command file interface in
RNAfold.
See the Changelog for version 2.3.0 for a complete list of new features and bugfixes. -
01 - 25 - 2016
Version 2.2 is out! After almost a year without a new release, we are happy to announce many new features. This version officially introduces (generic) hard- and soft-constraints for many of the folding algorithms. Thus, chemical probing constraints, such as derived from SHAPE experiments, can be easily incorporated into
RNAfold,RNAalifold, andRNAsubopt. Furthermore,RNAfoldand the RNAlib interface allow for a simple way to incorporate ligand binding to specific hairpin- or interior-loop motifs. This version also introduces the new v3.0 API of the RNAlib C-library, that will eventually replace the current interface in the future.
See the Changelog for version 2.2.0 for a complete list of new features and bugfixes. -
02 - 05 - 2015
Version 2.1.9 is a major bugfix release that changes the way how the ViennaRNA Package handles dangling end and terminal mismatch contributions for exterior-, and multibranch loops. We strongly recommend upgrading your installation to this or a newer version to obtain predictions that are better comparable to RNAstructure or UNAFold.
Please see the Changelog for version 2.1.9 for further details on the actual changes to the underlying energy parameters. -
04 - 13 - 2014
For a long time, Mac OS X users were not able to correctly build the Perl/Python interface of the ViennaRNA Package. Starting with v2.1.7, this limitation has been removed, and the interface should compile and work as expected. Please see the Install Notes for Mac OS X users for further details.
-
01 - 25 - 2013
Since ViennaRNA Package Version 2.1.0 we have enabled G-Quadruplex prediction support into RNAfold, RNAcofold, RNALfold, RNAalifold, RNAeval and RNAplot. See the changelog for details.
-
05 - 21 - 2012
A preliminary version of the ViennaRNA Package implementing RNA/DNA hybrid support can be found here
-
08 - 01 - 2011
With the new release of version 2, we introduce the most recent nearest neighbor energy model for all free energy calculations. Additionally, most of the stand-alone programs included are now able to read FASTA formatted input data. This makes conversion of you data files, as necessary in previous releases, obsolete!
Get the latest ViennaRNA Package
 Compile from Source Code
Installing from sourcecode is the recommended way to get most out of the ViennaRNA Package.
For best portability the ViennaRNA package uses the GNU tools autoconf, automake,
and libtool and can thus be compiled and installed on almost every computer platform.
See the INSTALL instructions for details.
For those interested in contributing to the development of the ViennaRNA Package by sending patches that add functionalities or fix bugs, we provide access to the master branch of the ViennaRNA Package repository at github.
 Install precompiled Binary Package
For those unable to compile the ViennaRNA Package, or who simply don't want to, we also provide precompiled binary packages for several Linux distributions and installer executables for Windows and MacOS X. To comply with the packaging standards of the corresponding Linux distributions we split the ViennaRNA Package into
- Core...
- usually the executable programs and utility scripts
- Development Files...
- the RNAlib C-library and the corresponding header files
- Perl Bindings...
- The RNA module to access RNAlib C-library functions from within Perl scripts
- Python Bindings...
- The RNA class to access RNAlib C-library functions from within Python scripts
The packages listed above are meant for installation in RedHat derived Linux distributions with enabled Extra Packages for Enterprise Linux (EPEL) repository. They should work without problems in distributions such as CentOS, RedHat Enterprise Linux, and Scientific Linux.
Two installers for Mac OS X are available here, one that is universal (universal) and should work out of the box for all x86_64 based Macs, and a second (homebrew) that links against packages taken from Homebrew. The packages we link against are Therefore, users are required to install the above packages in conjunction to the ViennaRNA Package when using the homebrew installer.
Note 2:
At the moment, our pre-compiled installer doesn't work for recent models based on Apples M1 Chip. Users who want to install the ViennaRNA Package on their Mac computer with Apple silicon M1 chip are advised to compile and install from source code.
 Build your own Binary Package from SourceCode
If you don't find a precompiled package for your linux distribution, or in case you just want to
create a binary package by yourself, have a look into the packaging/ directory of
our source tarball. It includes a list of some configuration files that we use for package generation:
First, for RPM based distributions, we use this SPEC file, originally written for Fedora, but meanwhile extended to work for at least the Linux distributions we provide binary packages ourselves.
Second, our binary package for ArchLinux was generated using this PKGBUILD file, which is also part of the viennarna source package available through the ArchLinux User Repository (AUR).
Third, the configuration files for our binary debian packages are included in the source tarball
within the packaging/debian directory.
Finally, for our MacOS X package, we make use of the pkgbuild, productbuild,
and hditool commandline tools. The corresponding configuration files are included in our
tarball in the directory packaging/macosx. For simplicity, you can instruct the
autotools toolchain to automatically build the installer disk image by adding the
following configure switch:
./configure --enable-macosx-installerThis creates a file
packaging/macosx/ViennaRNA-VERSION-MacOSX.dmg, where VERSION is
the current version number.
Our binary packages in the above section are mainly build using the openSUSE Build Service, while the Windows Installer is created using the MinGW cross-compiler and the NSIS install system. The MacOS X installer is build on a MacBook Pro.
Performance Analysis
To investigate the impact of the new energy parameters used in ViennaRNA Package 2 we did a quite
extensive performance analysis.
Overview
We have measured the Performance of ViennaRNA Packge 2 by comparing Minimum Free Energy (MFE) predictions of the RNAfold program to
- RNAfold 1.8.5
- RNAfold 2.1.8
- UNAfold 3.8
- RNAstructure 5.7
Benchmarks for other approaches in RNA structure prediction can be found elsewhere in literature or in the web.
Runtime analysis
Computational speed was measured using a dataset of randomly generated sequences with fixed lengths of
- 100 nt (100 samples)
- 500 nt (100 samples)
- 1000 nt (100 samples)
- 2500 nt (20 samples)
- 5000 nt (16 samples)
- 10000 nt (16 samples)
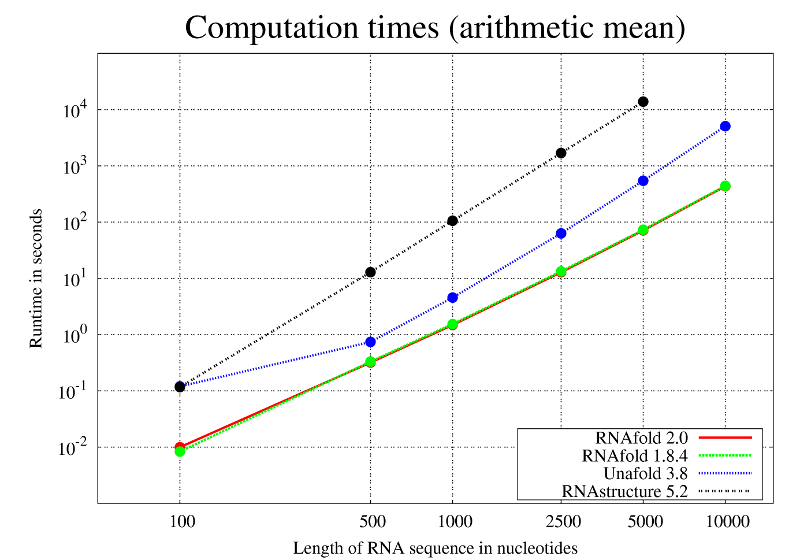
Unfortunaltey, RNAstructure 5.7 was not able to predict an MFE structure for the 10000nt samples in a relatively small time frame and thus was omitted in the particular test.
As visible in the computation times graph above, we observe virtually no difference in the runtimes of RNAfold 1.8.5 and RNAfold 2.0. This is also true for the memory consumption (data not shown).
Update: Runtimes for RNAfold 2.1.9 does not differ substantially to that of RNAfold 2.0.
Although all programs in the test have the same asymptotic runtime complexity, the computation time analysis of RNAfold compares quite favorably to that of the competing implementations.
Prediction accuracy
We calculated the following four performance measures to assess the prediction accuracy:
- Sensitivity
- Positive Predictive Value (PPV)
- Matthews correlation coefficient (MCC)
- F-measure
The test set was based on a set comprising 1919 non-multimer sequence/structure pairs taken from the RNAstrand database (all without pseudoknots in the reference structure). Both versions of RNAfold were run with -d2 option whereas UNAfold and RNAstructure were run with default options.
In the table below, the resulting arithmetic mean of each performance measure is shown. Furthermore, we did a bootstrapping analysis with 1000 iterations to estimate the 95% confidence intervals for the predicted measures.
| Program | Sensitivity | PPV | MCC | F-measure | ||||
|---|---|---|---|---|---|---|---|---|
| RNAfold 2.1.9 | 0.742 | [0.732,0.752] | 0.795 | [0.784,0.807] | 0.767 | [0.756,0.777] | 0.765 | [0.754,0.776] |
| RNAfold 2.1.8 | 0.740 | [0.729,0.750] | 0.792 | [0.782,0.804] | 0.764 | [0.754,0.775] | 0.762 | [0.752,0.773] |
| RNAfold 1.8.5 | 0.711 | [0.701,0.722] | 0.773 | [0.762,0.784] | 0.740 | [0.729,0.750] | 0.737 | [0.727,0.748] |
| UNAfold 3.8 | 0.693 | [0.683,0.704] | 0.767 | [0.756,0.779] | 0.727 | [0.717,0.738] | 0.725 | [0.714,0.735] |
| RNAstructure 5.7 | 0.716 | [0.707,0.727] | 0.781 | [0.771,0.792] | 0.746 | [0.737,0.757] | 0.744 | [0.736,0.753] |
The cumulative distribution of the MCC shows that RNAfold 2.0 (represented by RNAfold 2.1.8, and RNAfold 2.1.9) outperformes the other programs on the test dataset: more of its predictions are within the region of higher performance values.
However, a detailed look at the performance among different RNA classes in our test set reveals that it differs widely. No single implementation tested provides consistent superiority of results.
Other Packages
Here we list all versions of the ViennaRNA Package that contain special features which have not been included into the main release yet:
-
_ViennaRNA Package v2.6.0b
Preliminary release with support for non-standard salt concentrations and with modified nucleobases
-
ViennaRNA Package v2.3.0cuda
This is a preliminary version with CUDA (Nvidia GPU) support for RNAfold
Configure with./configure NVCC_PATH=/path/to/cuda/bin NVCC_SAMPLES=/path/to/cuda/samples CUDA_SMS="35 50 61"whereCUDA_SMSis a string specifying the CUDA compute capabilities. Here we include support for for Tesla K20, GTX745, and GTX 1060. You can check the appropriate CUDA compute capability for your GPU here: https://developer.nvidia.com/cuda-gpus. Simply use the compute level as displayed at the NVIDIA web site and multiply it by 10 to get a nice and clean integer number forCUDA_SMS. To find out the correct path toNVCCa simplewhich nvccshould suffice.
For all CUDA related environment variables, check the output of./configure --help.
Some answers to frequently asked questions can be found at W. Langdons CUDA RNAfold website. -
ViennaRNA Package v2.1.9h
This is a preliminary version implementing RNA/DNA hybrid support
Older Versions
There should rarely be a good reason to use any but the latest version of our software. However if you want to look up the old bugs, here's a list with most of the older releases for download.
Just click on the version numbers below to display the corresponding ViennaRNA Package releases.
Comments and Bug Reports
If in doubt our program is right, nature is at fault.
Comments and bug reports should be sent to rna@tbi.univie.ac.at