


BHGbuilder
 BHGbuilder takes a list of local minima as input and constructs a basin hopping
graph abstraction. Topology is abstracted from paths constructed by findpath procedure
from ViennaRNA Package. For every point on path,
BHGbuilder takes a list of local minima as input and constructs a basin hopping
graph abstraction. Topology is abstracted from paths constructed by findpath procedure
from ViennaRNA Package. For every point on path, BHGbuilder
searches for local minima by gradient path and stores connections between neighboring
local minima basins. These connections are then being re-evaluated by flooding and
printed to output. There is a multitude of options for interacting with BHG graph to
obtain additional data out of graph, such as optimal refolding paths, or refolding rates.
For compiling BHGbuilder, you will need the ViennaRNA Package
installed on your computer (tested with version 2.1.8). Then follow instructions in
README.txt bundled with program. Run
BHGbuilder -hto get help and available options.
In case you are using our software for your publications you may want to cite:
Basin Hopping Graph: A computational framework to characterize RNA folding landscapes
Bioinformatics 2014, doi:10.1093/bioinformatics/btu156, Supplementary material, ( bibtex)
Pseudoknots in RNA folding landscapes
Bioinformatics 2015, doi:10.1093/bioinformatics/btv572, Supplementary material, ( bibtex)
News
-
18 - 12 - 2015
New release 2.1 is out!!!
-
11 - 05 - 2015
New release 2.0 is out!!! Added support for pseudoknots (actually a class called 1-structures) and reduction of the rate matrix for computation of kinetics.
Download
 Compile from Source Code
BHGbuilder v2.1 (.tar.gz, SourceCode) [77.4kB]
You can also watch latest releases on GitHub: BHGbuilder GitHub (Do not be misled by a former name of the program - DSUeval)
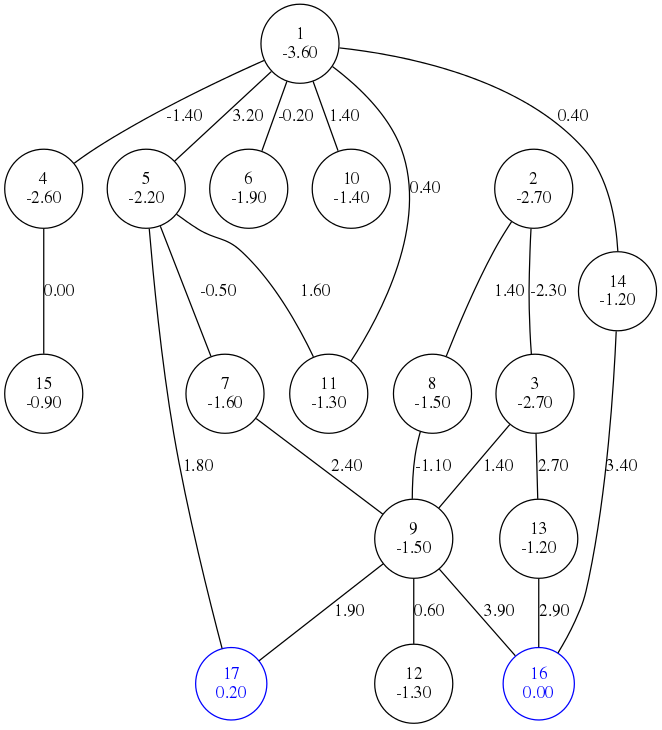
You can try the compiled program with the test3.LM example. Just use the command line call
BHGbuilder --graph-file=test3.eps --dot-energies < test3.LMand you should get the figure above with saddles.
In order to use the BHGbuilder to compute RNA folding kinetics you have to set up a little pipeline. At first you have to sample some structures, for example with the asearch_2.py script and an example sequence file in fasta fromat (seq.fasta):
python asearch_2.py -I seq.fastaThe samples from different runs are in the files seq.lm1 - seq.lm9. The local minima (gradient basin representatives) are in the file seq.lm. If you want to model the folding behaviour from the open chain structure, you can edit the file seq.lm and append the following line (index, structure, energy, number of occurences):
544 ................................ 0.0 1Then run BHGbuilder:
BHGbuilder --rates-file=test.rates < seq.lmThe output in the terminal shows all input structures and new local minima that were discovered on the direct path between all input structures. The rate matrix is in the file test.rates. The corresponding structures for the columns of the rate matrix are in the file test.ratesO. In order to compute the RNA folding kinetics you need both files to run treekin. At first you have to find the line index of the start structure in the file test.ratesO. For example with:
grep -n -oF "................................" test.ratesOIn my case it is 65. The correct index is 64, because the first line contains the sequence. Finally you can call treekin, which computes the population densities until an equilibrium (or the time threshold) is reached:
cat test.ratesO | treekin -m I -f test.rates --p0="64=1" > treekin.outThe file treekin.out contains the trajectories for the population densities for each cluster representative in the test.ratesO file. The first column is the time and the following columns correspond to the structures in test.ratesO (in the same order).
Older versions:
There should rarely be a good reason to use any but the latest version of our software. However if you want to look up the old bugs, here's a list with most of the older releases for download.
Contact
In case of problems, found bugs, or need to chat, do not hesitate to contact us:
- marcel
 tbi.univie.ac.at -- programming
 - qinbioinf.uni-leipzig.de -- ideas
Comments and bug reports should be sent to rna@tbi.univie.ac.at